DISS6
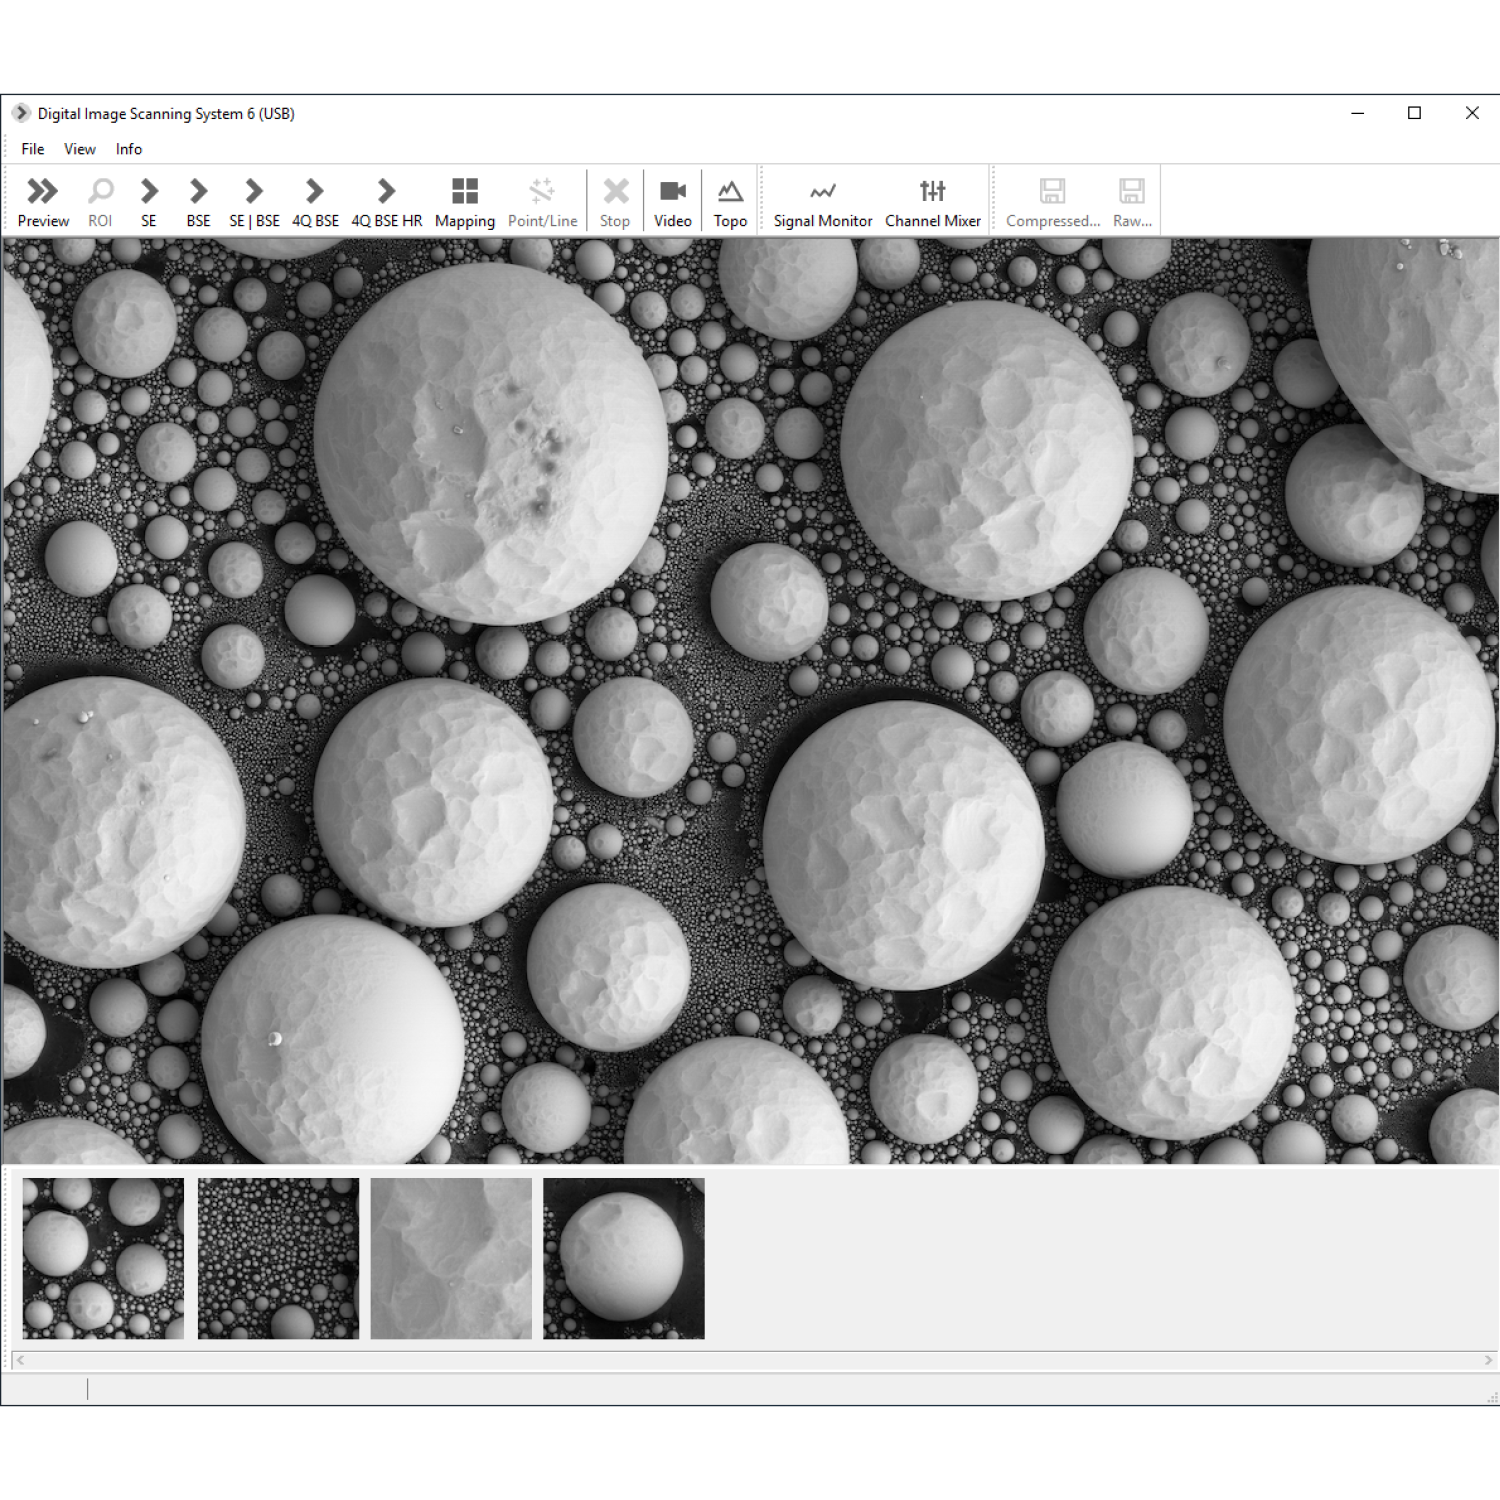
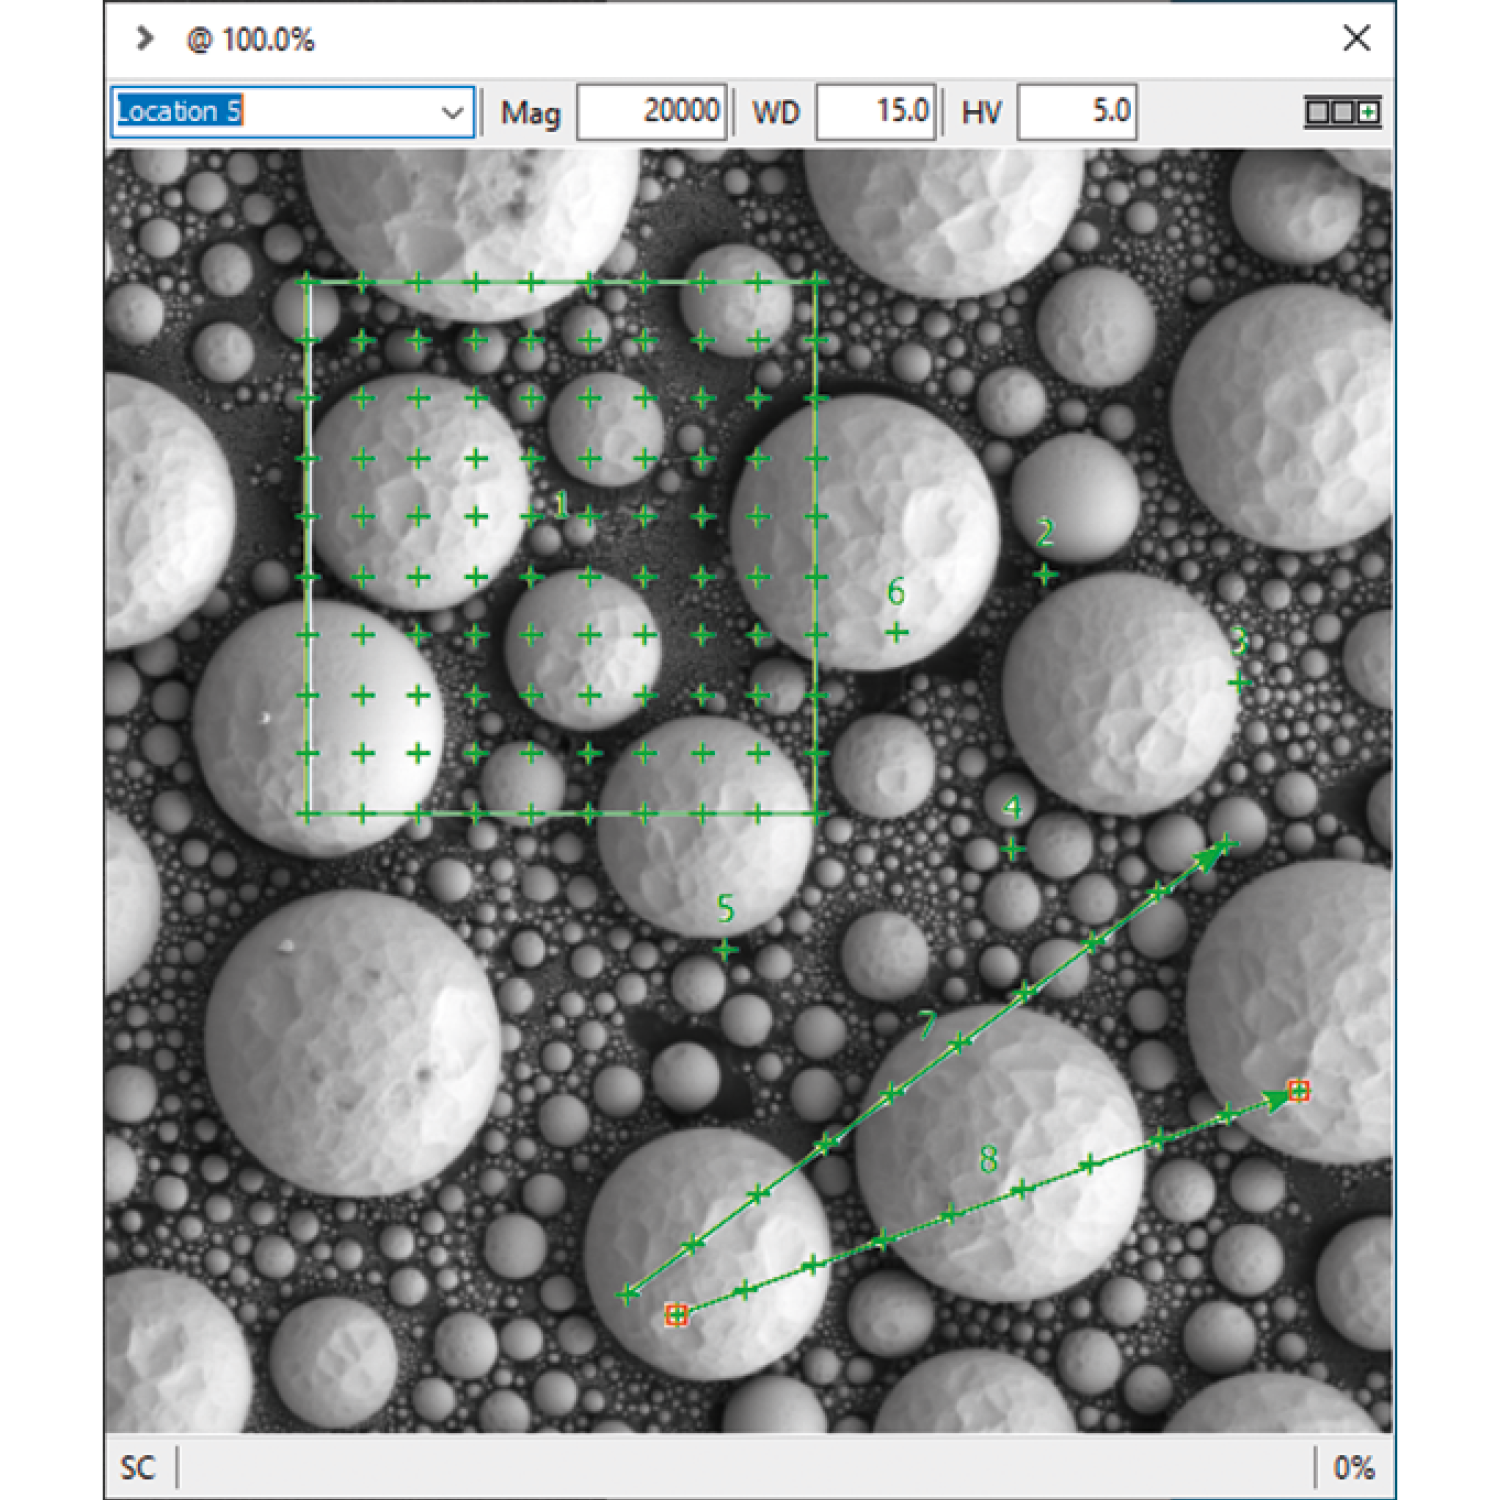
Image acquisition and control functions are integrated into the DISS6 software to manage multiple devices, from scan controllers, amplifiers and detectors to full SEMs. Workflow is highly optimized with configurable panes and buttons, simultaneous signal acquisition and live signal inspection tools. Standard features include region of interest (ROI), line and point scans, live image mix in colour and automatic quantification of analog signals.
Optional plugins fit into a range of advanced techniques, including current-voltage plugin for Electrical Analysis, topographical reconstruction plugin for Geometrical Analysis and IR Chamberscope framegrabber plugin for SEM upgrade kits. The software is built on standard file formats, for image data, metadata, configuration, settings, and remote communication. It is Windows 11…7 compatible and uses USB or ETH interfaces to communicate with the hardware.
Fully configurable workflows for individual needs
- Each scan profile in the workflow is fully configurable
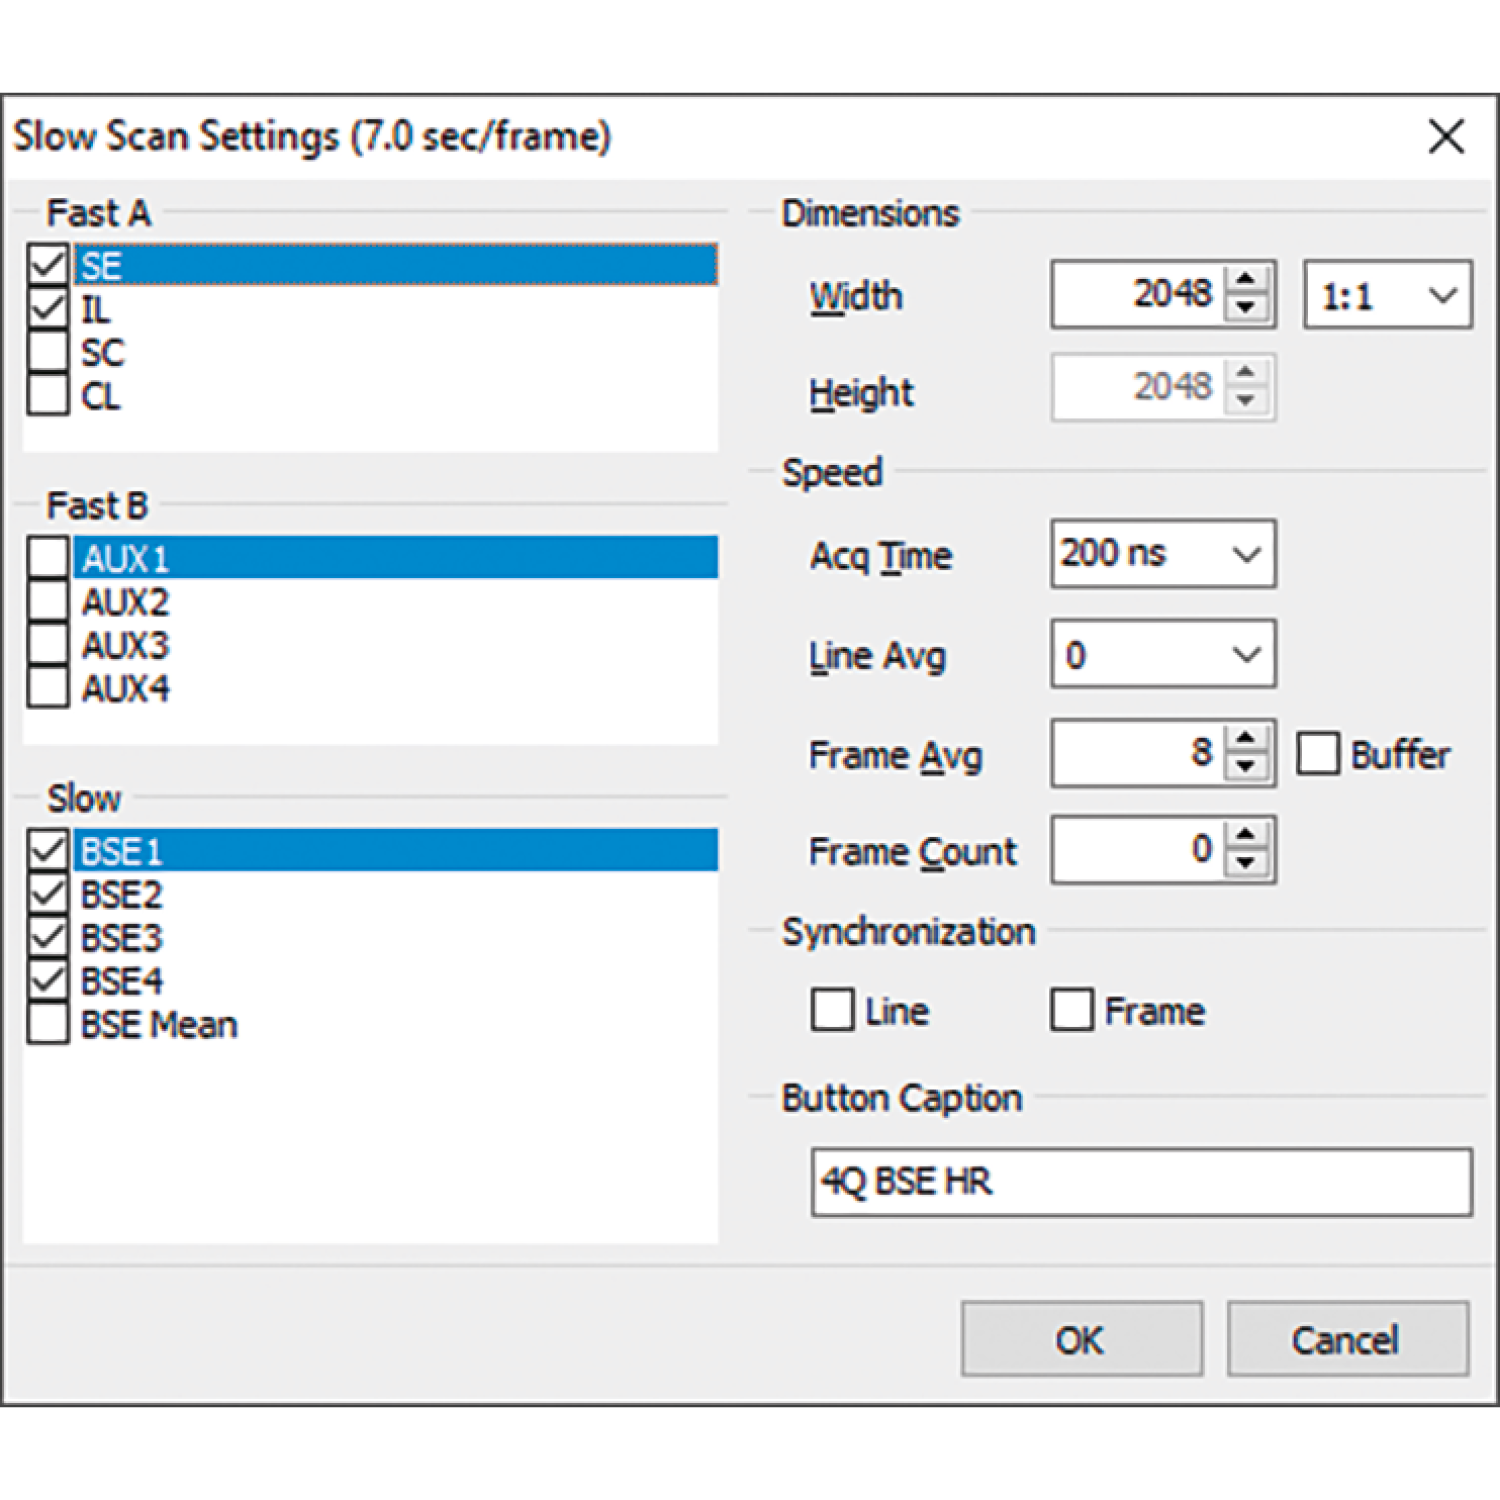
- New scan profiles may be added from templates for live view, ROI, slow scan and mapping
- Live view and ROI scans are optimised for fast alignment and navigation
- High-resolution slow scans are best for simultaneous signals, localization and mixing
- Mapping scans capture digital signals from pulse processors
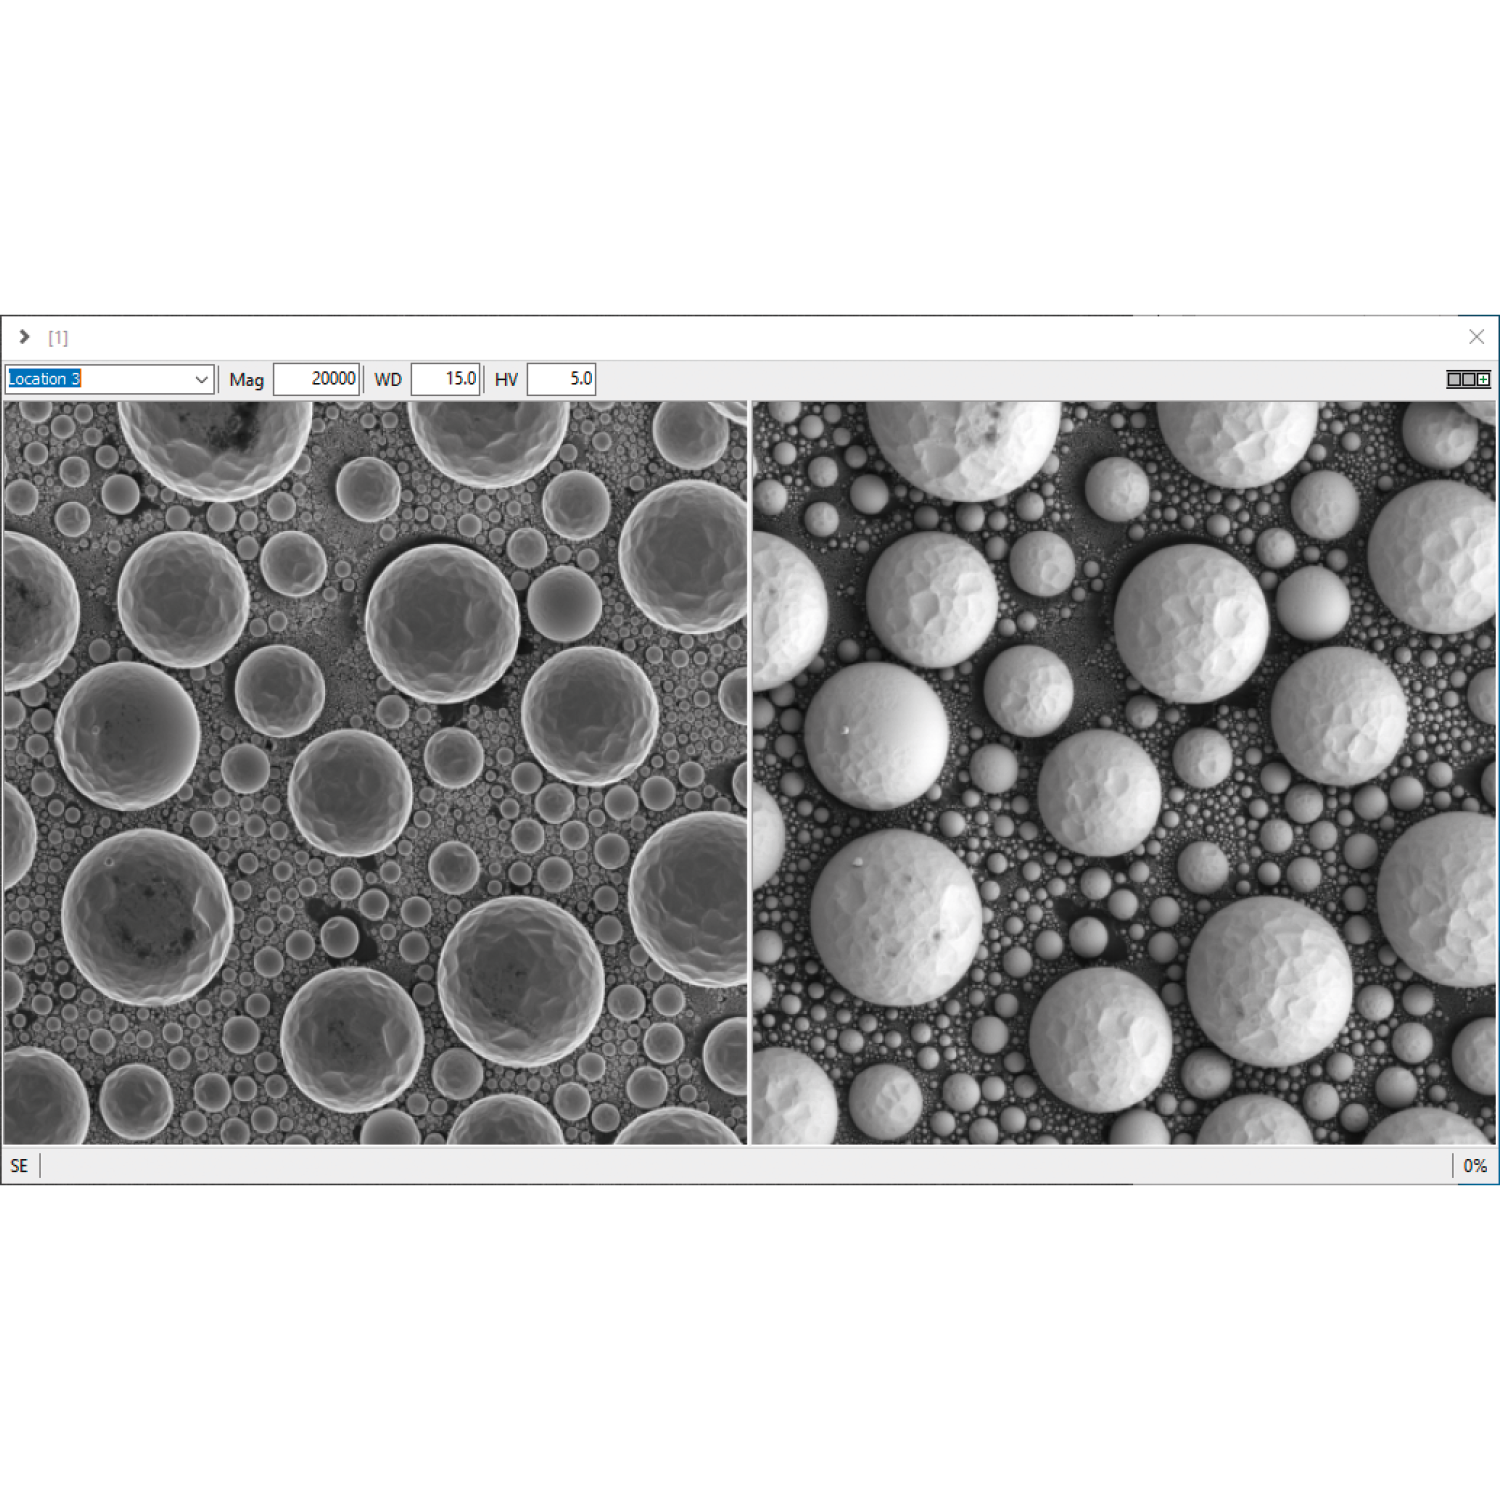
Tools for live display, colour mixing and quantification of pixel values
- All simultaneous signals are displayed as tiled images
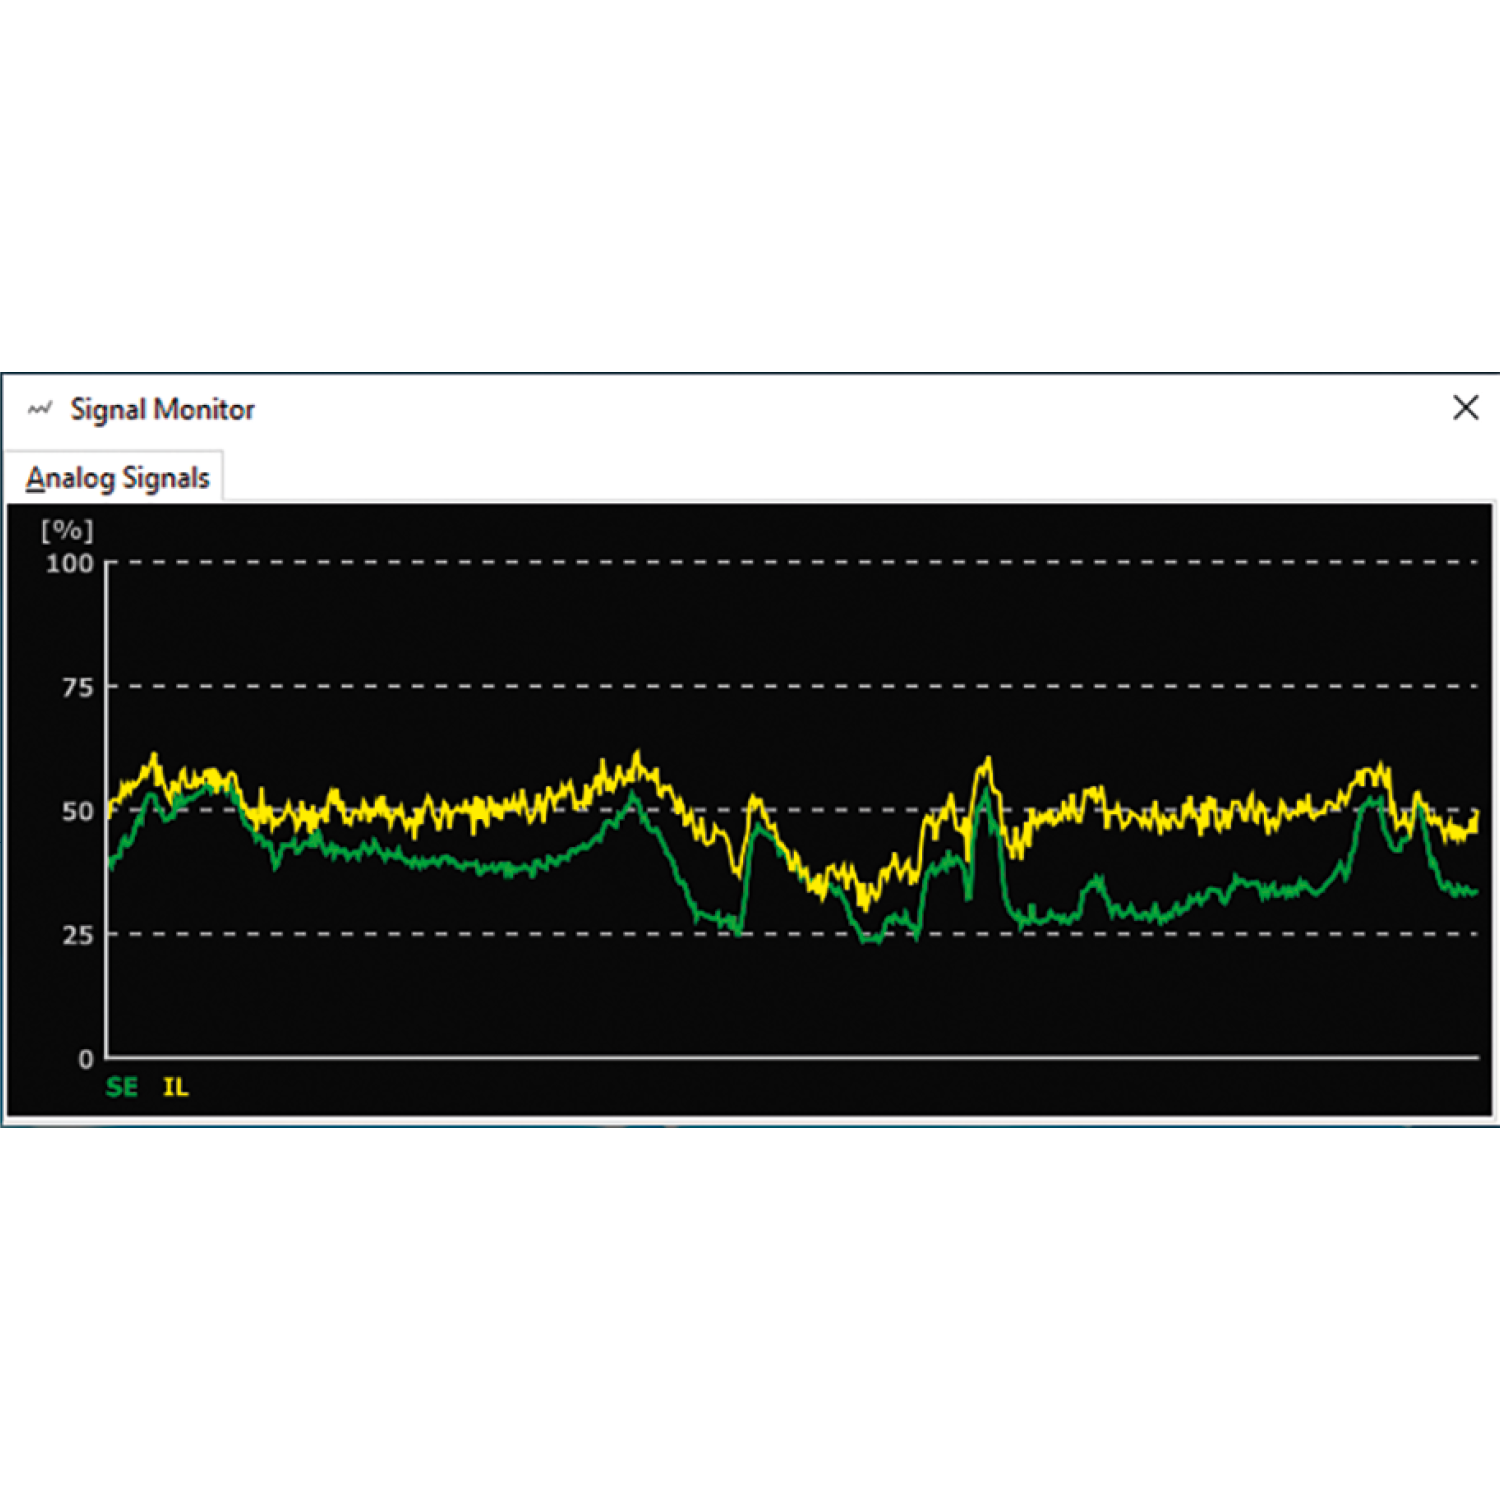
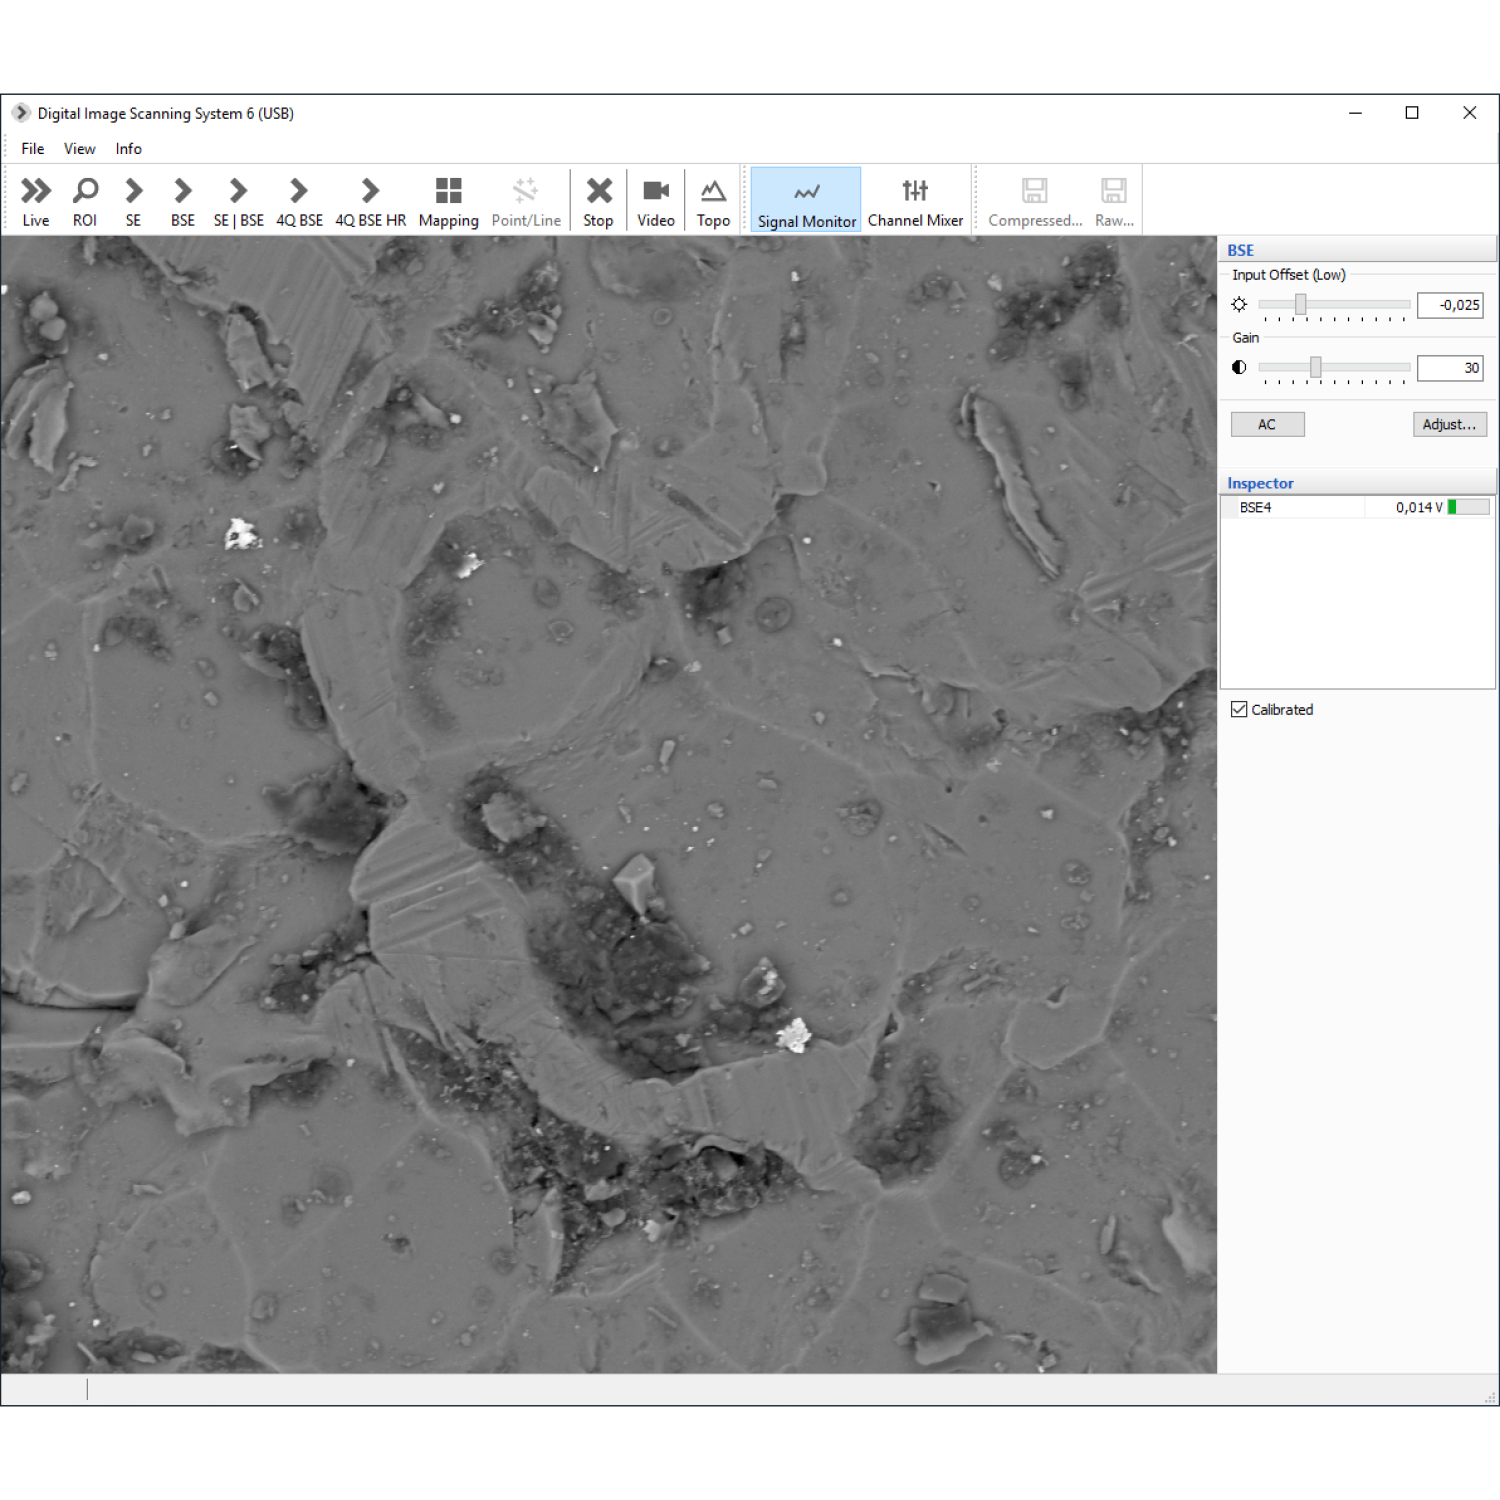
- Live line scan and histogram are displayed for best brightness and contrast adjustments
- Calibrated measurements from pixel values are displayed live in the inspection tool
- All available signals may be mixed in live color image
Area, line and point measurements for analytical techniques
- Area, line and point scan profile enable advanced control of acquisition parameters
- Subpixel scans improve sampling for complex samples
- Multiple live line profile graphs are displayed for simultaneous signals
- Scan geometry and data is exported to XLS and CVS
Images and data are saved in standard file formats
- TIF un-compressed grayscale data
- JPEG compressed grayscale data
- PNG colour images
- XMP metadata
- GGR colour gradients
- XML formula
- CSV pixel values
BSE Topography
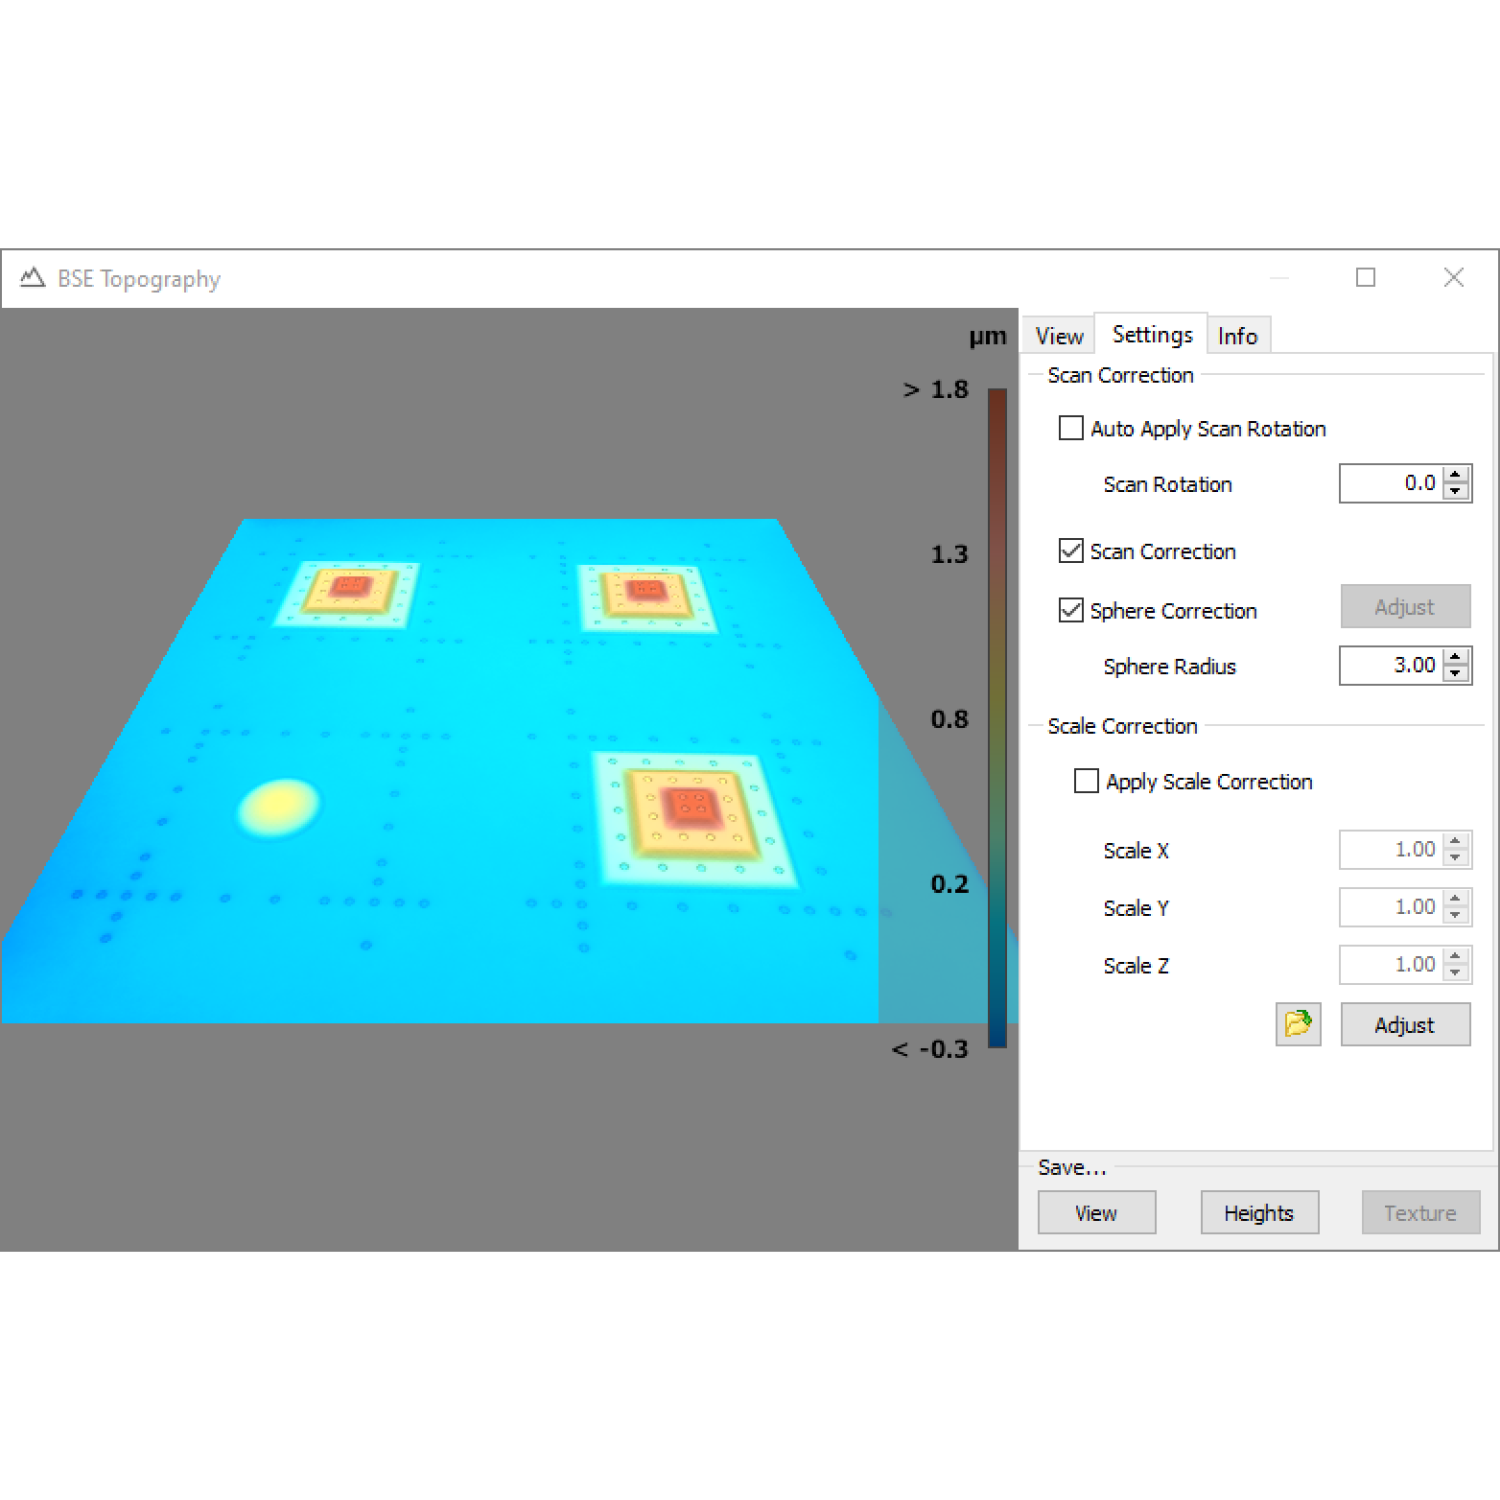
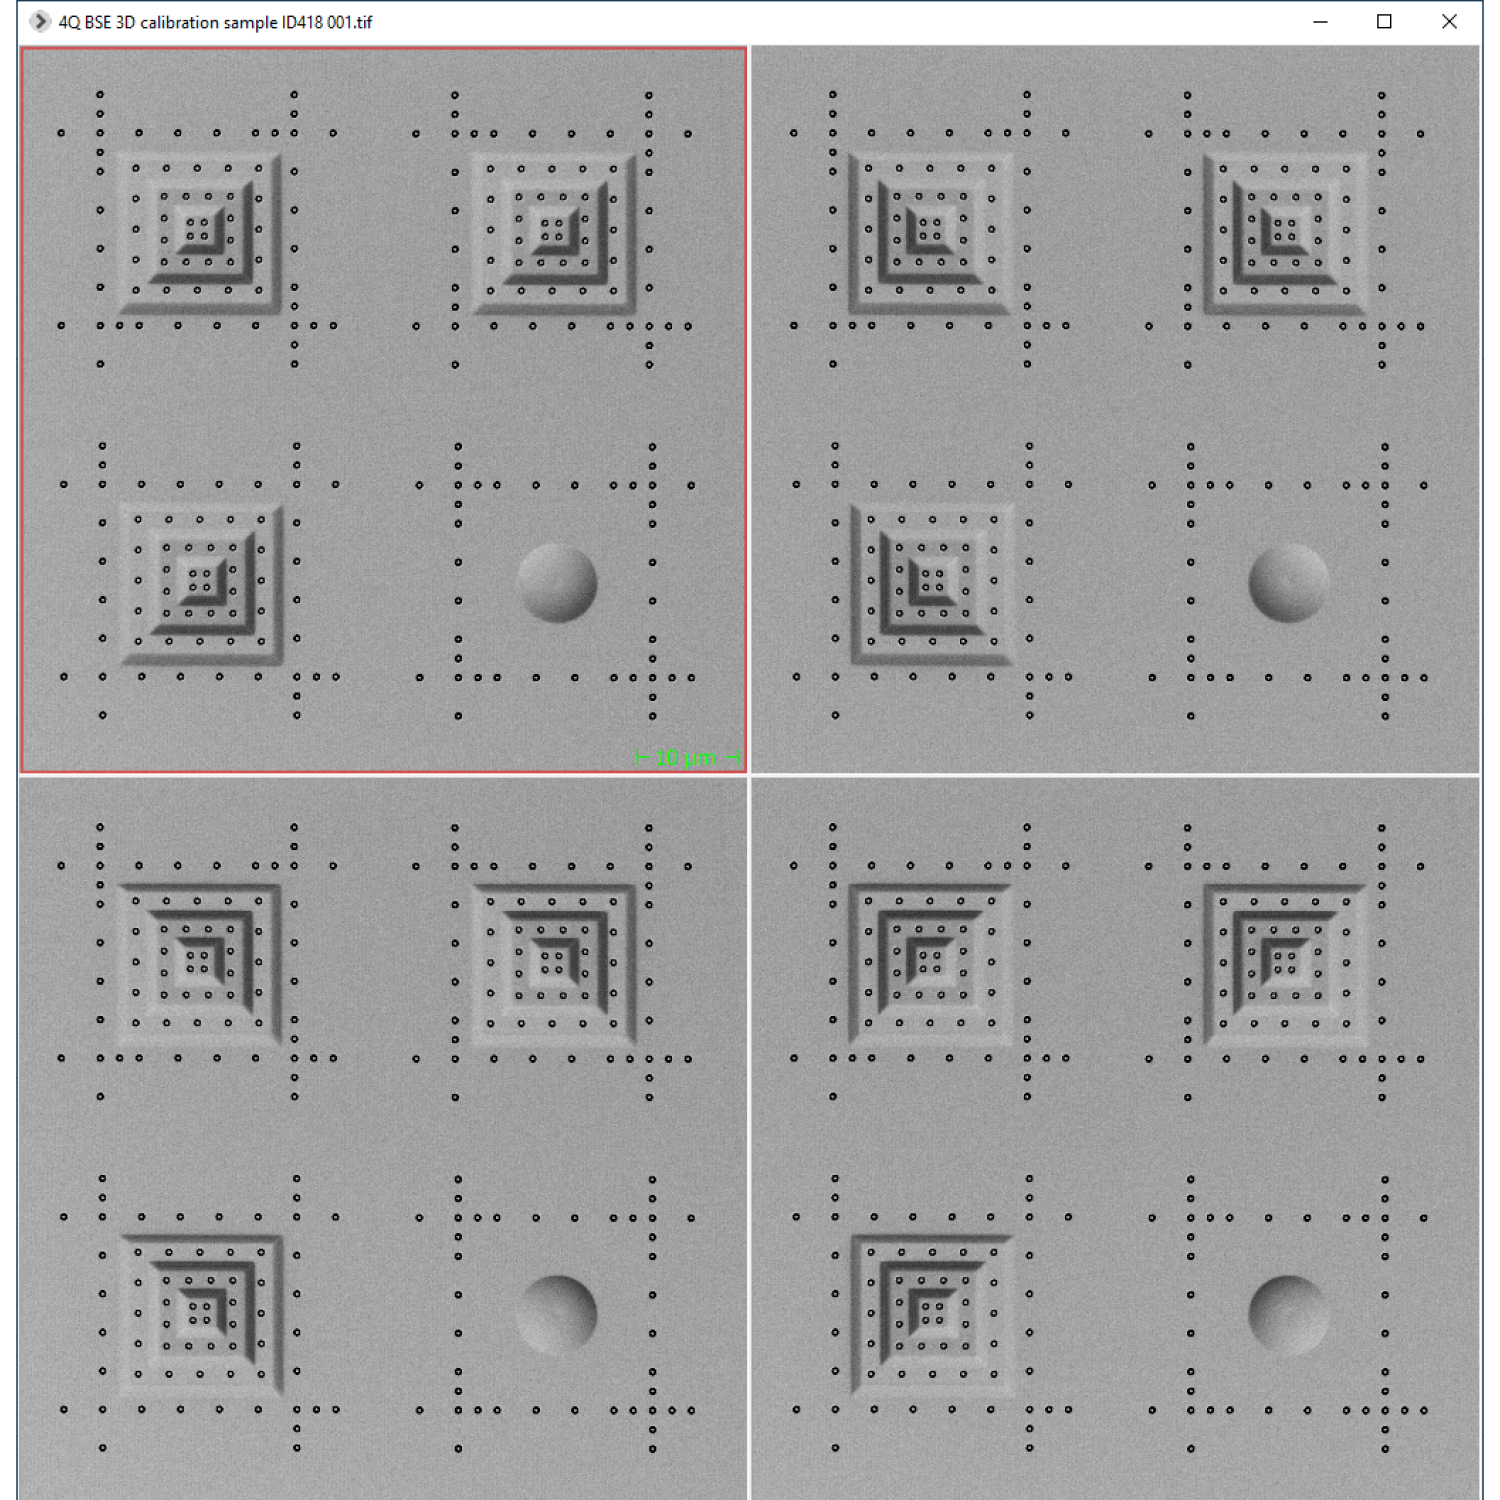
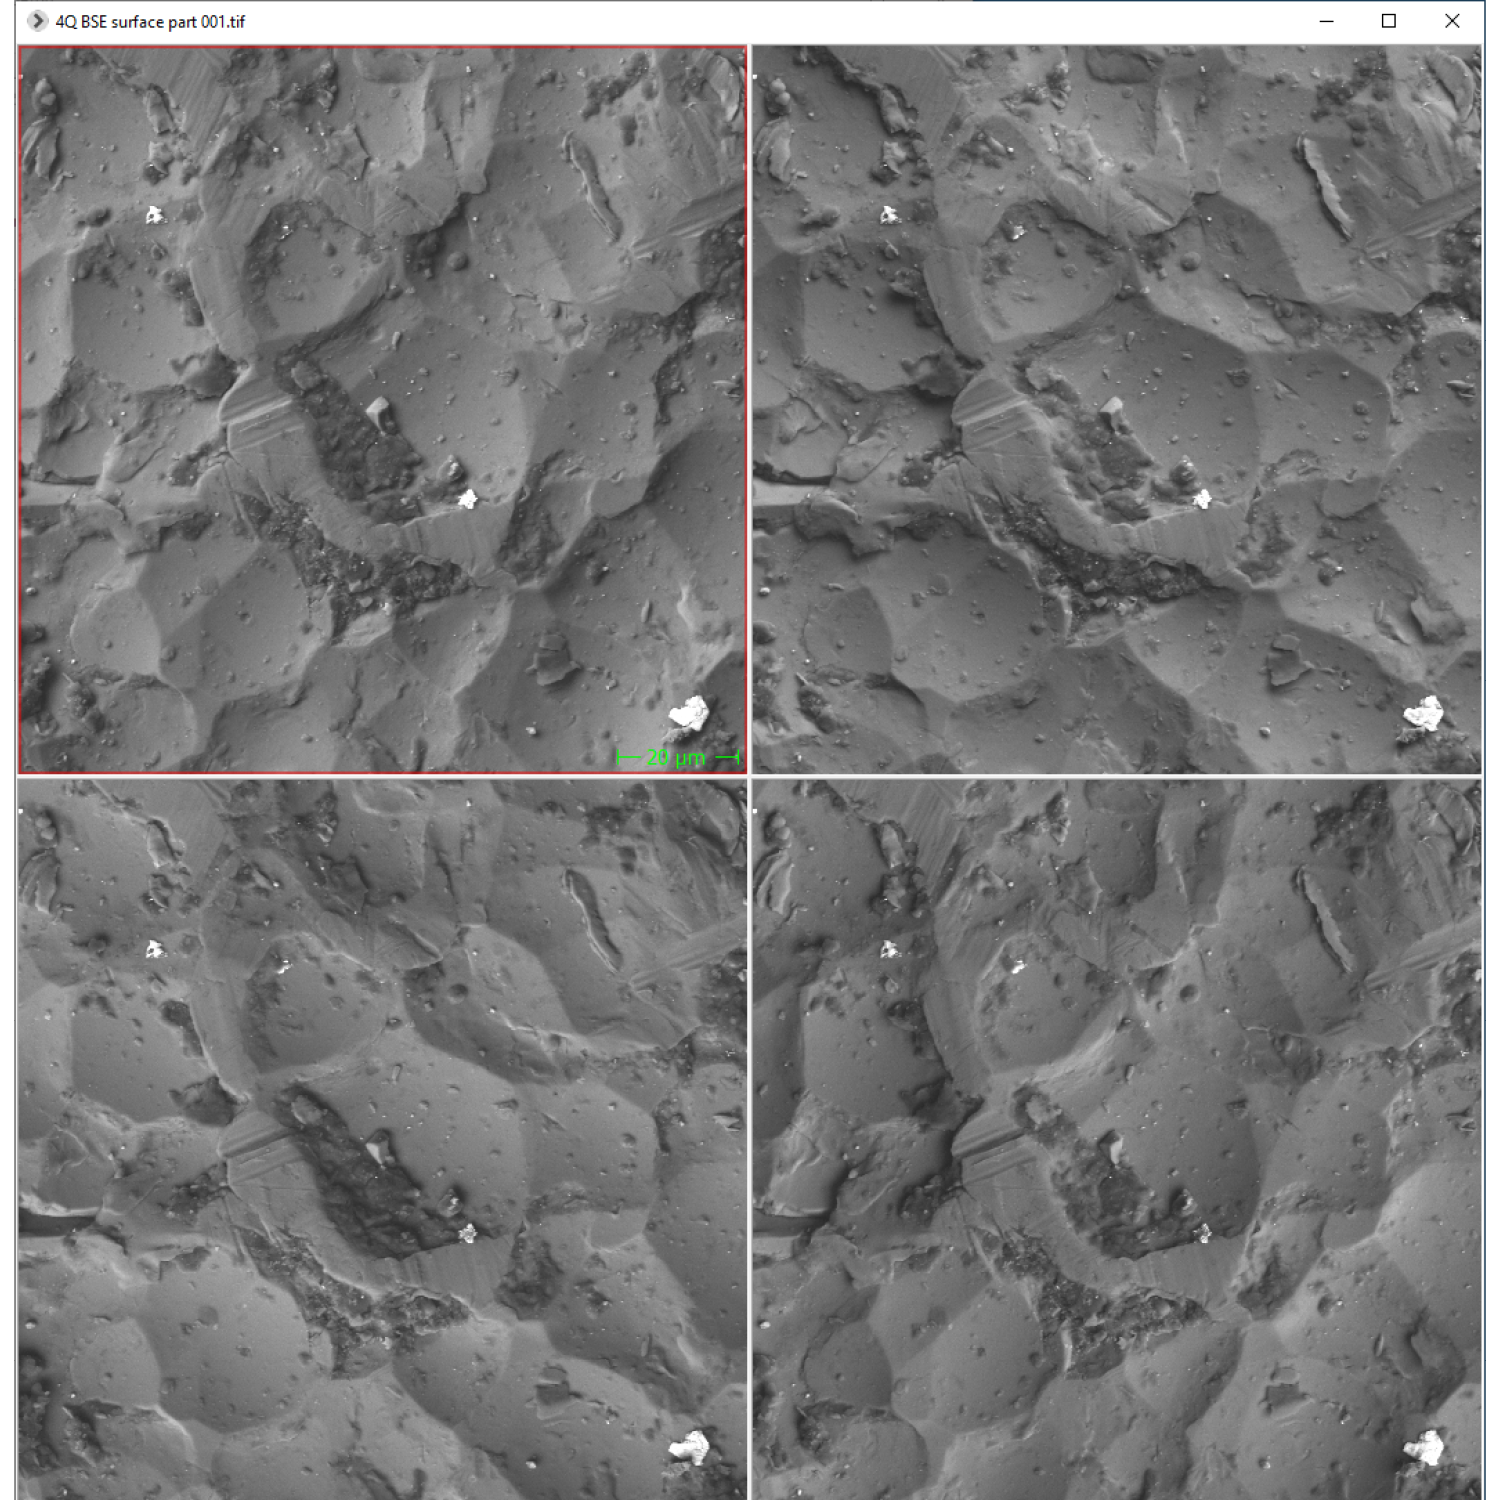
BSE topography plugin provides integrated live 3D reconstruction of topography data from 4Q BSE detector signals with shape -from-shading. It is applied in SEM and FIB-SEM for a wide range of measurements, from basic coordinates, distances or angles to more advanced volume, step height, or roughness characterization.
- Live 3D view of topography data with various options for rendering and coloured views, with rotate, shift, zoom and scale
- Calculate topography independent backscatter values and gradients and apply as texture
- Save rendered 3D views (BMP), topography data (AL3D, SDF, 16-bit TIFF) and texture (TIFF)
- Adjust and apply geometric scan corrections
- Save calibration parameter for different SEM setups
- Adjust and apply lateral and height scale correction (requires 3D calibration standard MMC-80-4BSD)
- Independent from changing brightness and contrast of BSE-signals (requires calibrated amplifier MICS)
- Free configurable detector geometry (WD correction for different height mounting, radial distance, mounting angle)
Current-Voltage sweep
Current-Voltage (IV) sweep tool is using the integrated bias voltage source and current measurement in the EA amplifiers and EFA controllers to automatically record device curves. It is used to verify correct electrical connections to the device, select bias volage for EBIC and EBIRCH techniques, and check for beam damage over the duration of the experiment.
- Configurable voltage range, number of points and measurement time
- Auto-range for the entire sweep, or for each sweep point
- Live plot display during measurements
- Export of plot to image file, and data to spreadsheed
